


The world of finance is changing at a fast pace, and so is the demand for financial data analysis.
With the rapidly changing financial landscape, data analysis and research platforms are evolving to meet the demands of dynamic economies.
Investors, analysts, and traders all need accurate data to make informed decisions to unfold new potentials.
In this article, we will explore the best financial data analysis and research platforms to keep you updated on the investing landscape. Furthermore, here’s a handy list of the best financial data analysis or research platforms to get you started.
Title
Description
Explore
Koyfin
Global analytics platform for stocks, ETFs, and model portfolios.
Benzinga Pro
Finance streaming with live news, daily trade picks, scanners.
Roic.ai
Free financial data, past statements, transcripts, and charts.
Bloomberg
Real-time data, APIs, tools for financial professionals.
Markets.ft
Trusted financial news, tools for stock and economic analysis.
WSJ
Reputed international newspaper, digital and print financial news.
YCharts
Finance platform for technical analysis, charts, and economic data.
FullRatio
Visual market data, customizable tools for stock analysis.
TipRanks
Research tools, stock analysis, forecasts, and news updates.
Stock Analysis
Charting tools, technical indicators, stock news for 6000+ stocks.
WallStreetZen
Stock research platform with visual data, Zen Score indicator.
Importance of Correct Financial Data for Analysis
Financial data forms the foundation for stock market research and fundamental analysis. Since all the decisions are based on the input numbers, it’s crucial that the data be accurate and up-to-date.
Here are some reasons of why you need correct data for market analysis.
#1. Valuation: As an investor or a cautious trader, it’s essential to know the correct value of a stock. Fair valuation brings in the required comfort for long-term investors and positional traders. A high level of accurate data such as balance sheets, cashflow, income, and earnings reports are a must to determine the correct valuation of a stock.
#2. Planning: Individual traders and fund houses build and plan their strategies looking at the income reports and quarterly results of a company. Accurate data helps investors to execute their plans of being invested or work on capital allocation in a given stock.
#3. Understanding Risk: Correct financial data is useful for assessing the health of a company and to determine its stability. All key financial ratios are based on accurate data for evaluation and maintaining a balance of risk-to-reward ratio.
#4. Economy Analysis: The need of accurate financial data is not only limited to companies, it also helps in understanding the economy on a macro level. All government initiatives take place after evaluating the macroeconomic conditions based on financial data.
#5. Predicting Trends: Market trends keep changing over time. Accurate data forms the basis of analyzing stock prices, movements and determining growth rate. A deeper understanding of the economy also helps in better pricing of products for businesses.
#6. Competitor Analysis: Correct data is crucial for comparing the stock price, valuation and trends in a given sector thus, assisting in better competitor price tracking and monitoring.
Correct data enables analysts and businesses to take well-informed decisions. Using unreliable data makes the entire analysis process weak, which may result in poor decisions and wrong outcomes.
Also listen to these🎧: Inspiring Finance Podcasts to Empower Your Wealth-Building Journey
Now that we have understood the importance of correct data and how it affects your outcomes, it’s time to start our list of financial research platforms, well regarded for their data in the finance community.
Koyfin
Koyfin is an analytics and financial data platform for analyzing global stocks, ETFs, mutual funds, macrotrends, and model portfolios. Just like TradingView, it assists traders and investors in researching stocks and other securities with the help of charting dashboards.
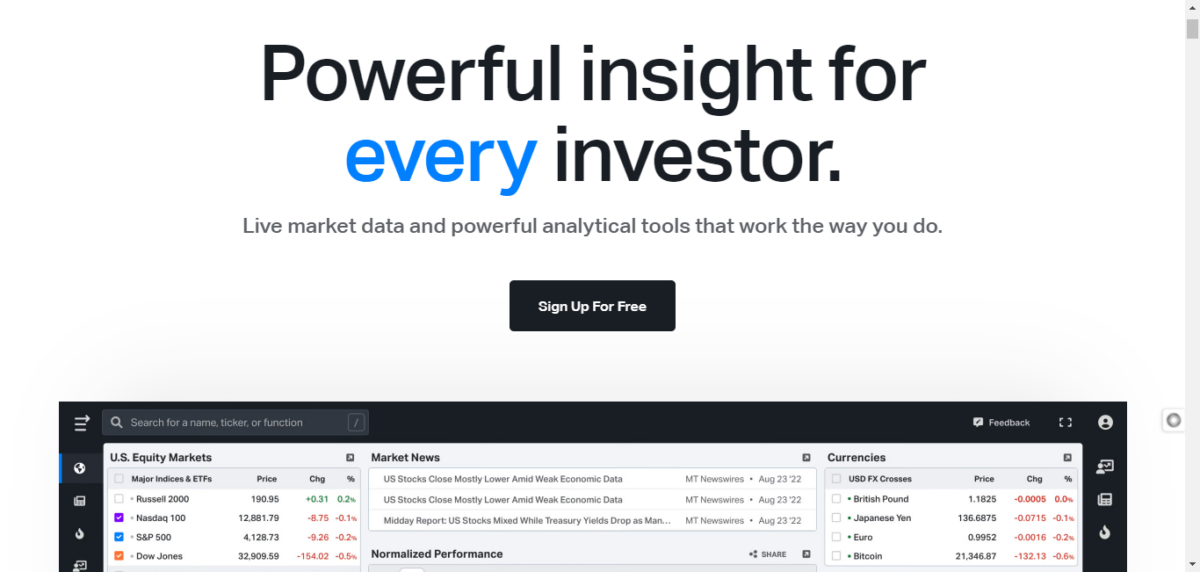
Using Koyfin, you can gain insights into a company, assess bulk data with the help of visualization tools, and create macro trends through dashboards. With the help of these data-driven and insightful fundamental tools, analysts can scan over 100k global securities and make better investment decisions for their clients and companies.
Koyfin’s equity screener has over 5900 filter criteria that help you find opportunities in globally listed securities without going through the trouble of manual search. The macro dashboard feature helps you make the best financial models with the right contextual elements (widgets) that you want on a screen. You can customize the dashboard using drag-and-drop widgets including a list of stocks, charts, and news.
Some other remarkable features include a portfolio analysis tool, dividend snapshot, earnings calendar, percentile rank snapshot, and more that can be easily accessed on desktop and Koyfin mobile app.
Also read: Best Crypto Portfolio Tracker Apps
Benzinga Pro
Benzinga Pro is a finance streaming platform that provides live newsfeeds in the market to retail investors. This good or bad news helps you find breakout and breakdown stocks before they rally.
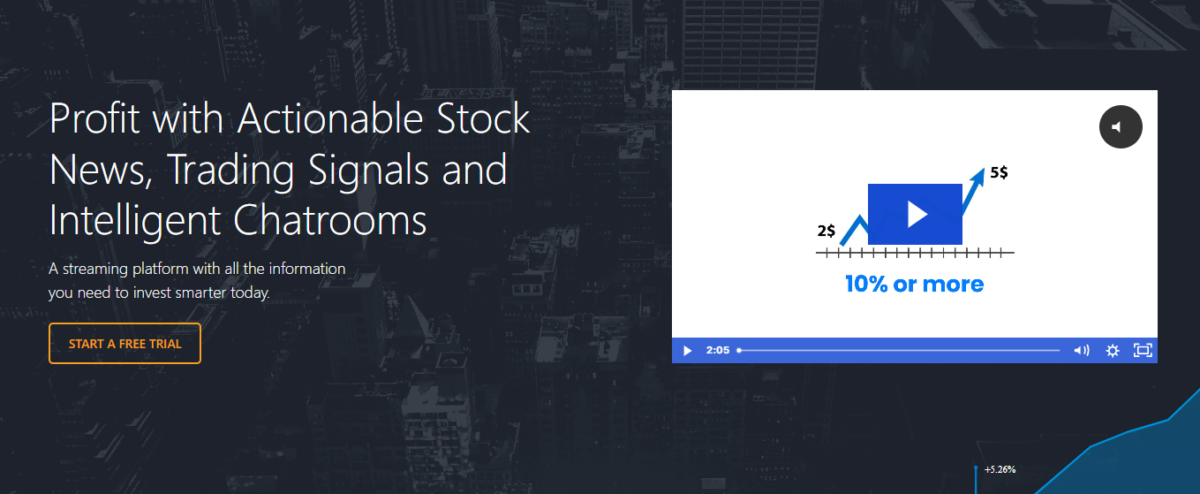
Benzinga Pro keeps looking for new developments, news, and events in the market that move stock prices. It not only provides meaningful data to brokerages like MarketWatch but also you retail subscribers, so they can participate in the stock news-based actions.
Apart from streaming stock news, some of the powerful features that Benzinga Pro provides daily trade picks, stock signals, stock scanners, and stock price mobile alerts.
Benzinga Pro’s stock calendar helps you pull up everything about ongoing events like IPOs, dividends, earnings, analyst ratings, and more in a single place. Each calendar has its filters that relate to events helping you find what exactly you’re looking for.
Roic.ai
Roic.ai is a website that gives you financial data about a company including free download of upto 30+ years of past financial statements.
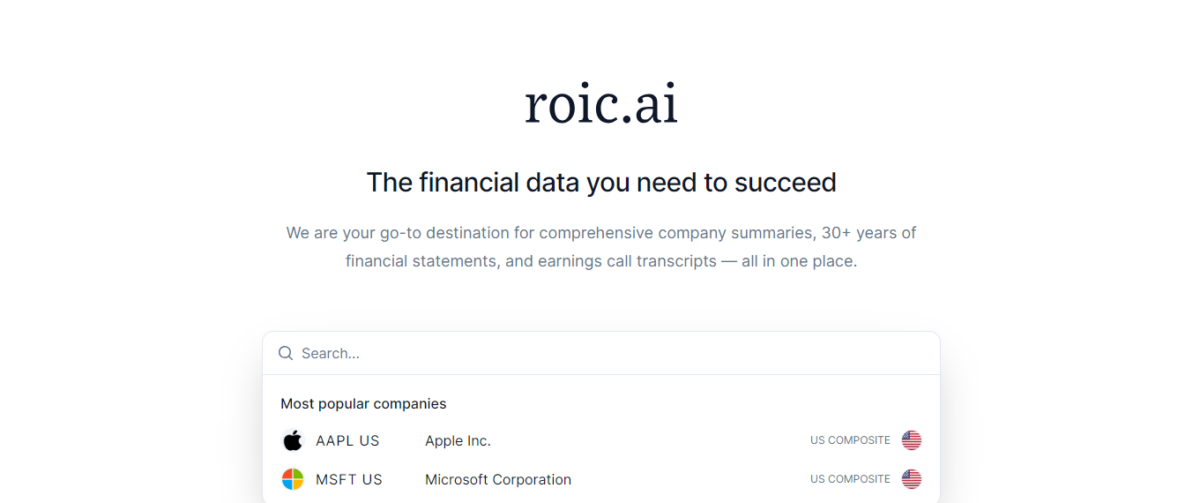
On their homepage, enter the stock name, and you get two areas to explore – financials and summary. The financials tab provides all the necessary fundamentals such as income statements, gross profits, quarterly performance, dividends, balance sheets, and more.
Roic’s transcripts tab includes the messages from the company’s official conference calls, so you can check all the details and plans in one place without finding the transcripts in other places.
The platform also has a classic view where you can see the stock chart with some basic technical information. You can check the stock performance from its year of commencement to date without paying any charges.
Quartr
Quartr is a financial website as well as a mobile app that provides easy access to equity news and first-party real data from, 8000+ public companies.
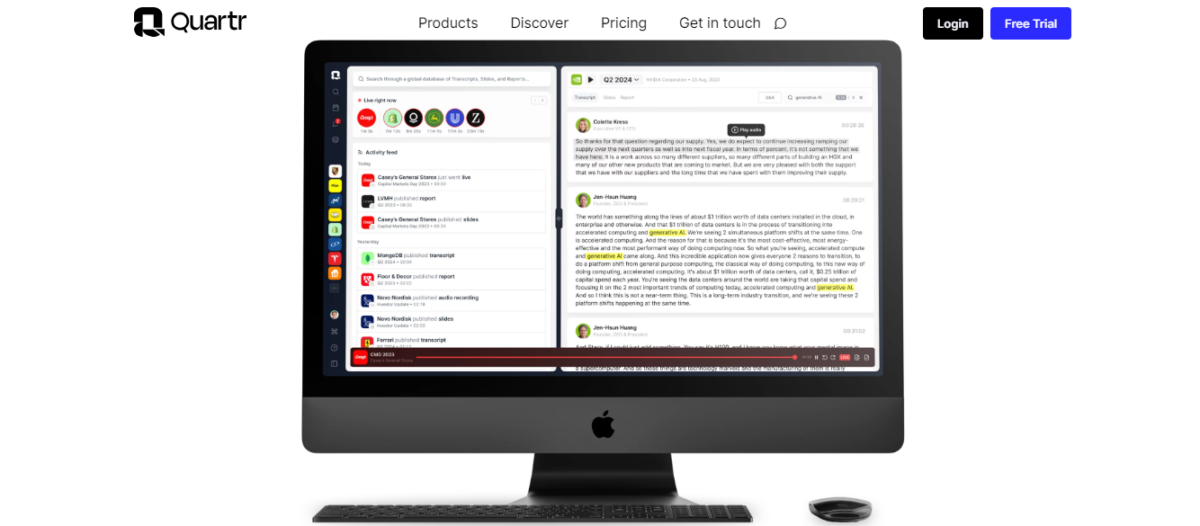
The Quartr web app helps you improve your stock research, streamline your workflow get meaningful insights about company events, and niche sectors and get a view of the overall market.
Whereas, their mobile app offers you all the live earning calls, event earning reports, searchable transcripts, consensus estimates, and multiples. The app is free to use and you can search through transcript database of earning calls, investor conferences, and audio-connected transcripts in just a few clicks.
Bloomberg
Bloomberg is a popular platform used by financial professionals to access real-time data about stocks, and trading news. It provides quality financial data that is integrable with some popular tools that companies use of analyzing markets.
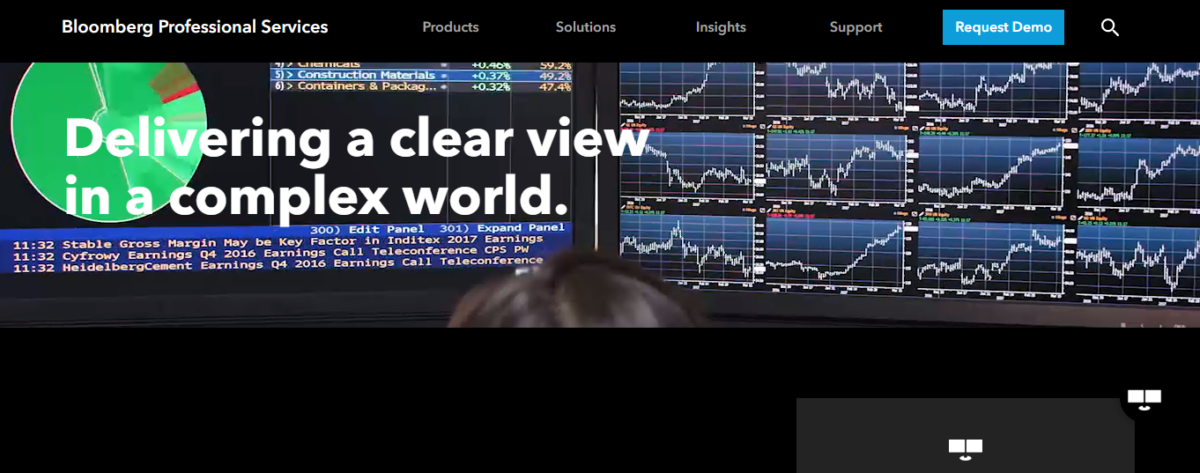
The platform provides APIs and tools to create connected financial systems securely. For example, the Bloomberg terminal gives access to the latest news, data, and trading tools that help financial analysts make better statistical decisions.
You can create efficient workflows and order management solutions with desktop applications, alerts, charting capabilities, and portfolio monitors.
Markets.ft
Markets.ft, known as Financial Times is one of the leading financial news websites recognized for trustworthy financial content. It covers news about stock market-listed companies, businesses, financial events, world economics, and global affairs.
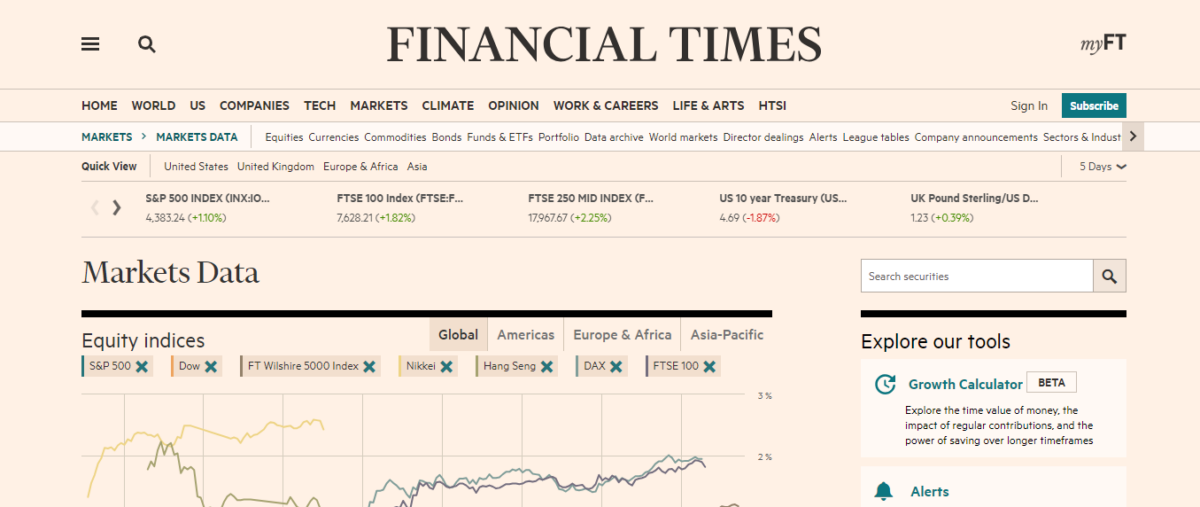
In addition to the in-depth reporting of events and news reporting, the Financial Times runs various subscription-based model that gives you access to premium articles and other FT forums. You can also check all the news, videos, and stories on their mobile app.
Financial Times provides plenty of financial tools to analyze stocks, currencies, and other financial instruments like commodities.
WSJ
Wall Street Journal (WSJ) is one of the most reputed international newspapers that covers financial news, businesses, world economic trends, and financial events. It’s available in print and online websites with a significant digital presence.
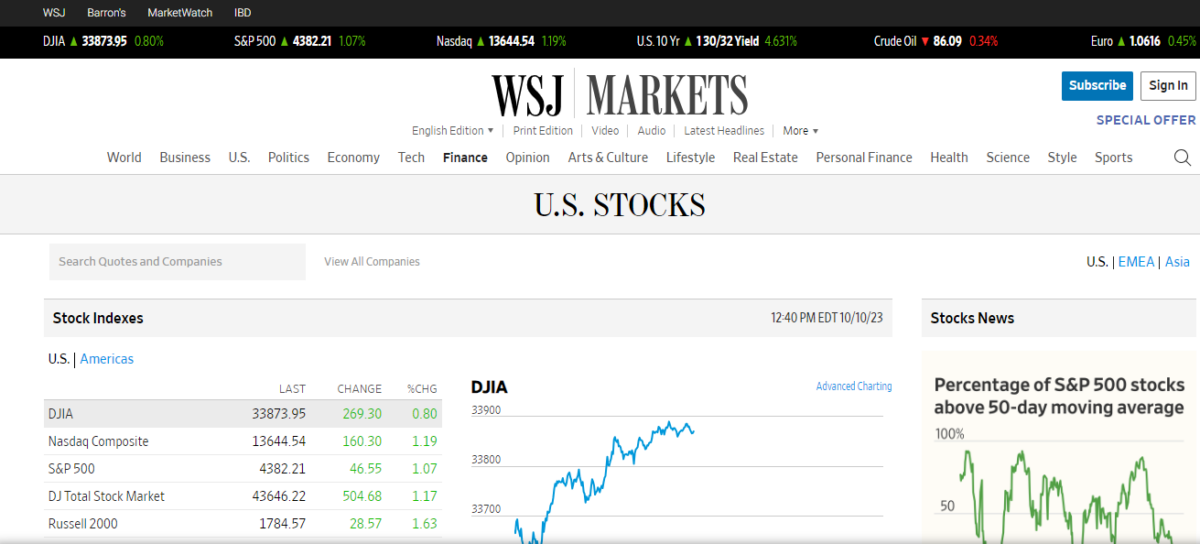
It is the WSJ’s mission to provide readers with the tools and resources they need to track and analyze the financial markets, such as stock quotes, market data, and interactive charts, to help them do that.
Being a renowned platform, it has an extensive digital archive of past performances, events, and content that helps researchers with historical data. The platform hosts various events and conferences featuring financial speakers and thought leaders.
YCharts
YCharts is a finance platform dedicated to technical analysis like charts, stock screeners, and analyzing equities, ETFs, and so on. Some prominent tools include model portfolios, fundamental charts, fund screeners, portfolio optimizers, custom reports, and technical charts.
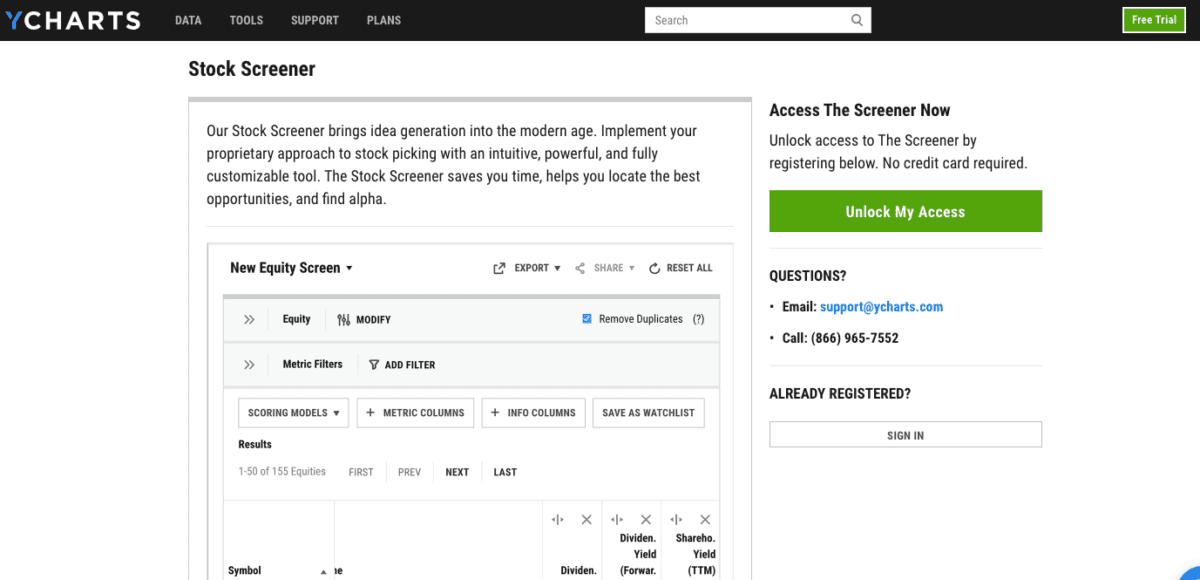
Apart from YCharts stock screeners, the platform offers data that help you understand the fundamental aspects of stocks. You get access to 500,000+ economic indicators & data points, in a sortable calendar format. According to YCharts, data is collected from the Federal Reserve, Bureau of Labor Statistics, and other sources.
Besides, YCharts has different types of calendars, such as economic calendar and an events calendar. You can view recent and upcoming events in the economic calendar and filter data based on country or topics. Whereas, the events calendar gives you insights into earnings, dividends, stock splits, and other company-related events.
FullRatio
FullRatio is a website that provides market data in a visual format, making it easy to understand and perform analysis. You can use the data available on the platform to analyze securities and build better investment portfolios.
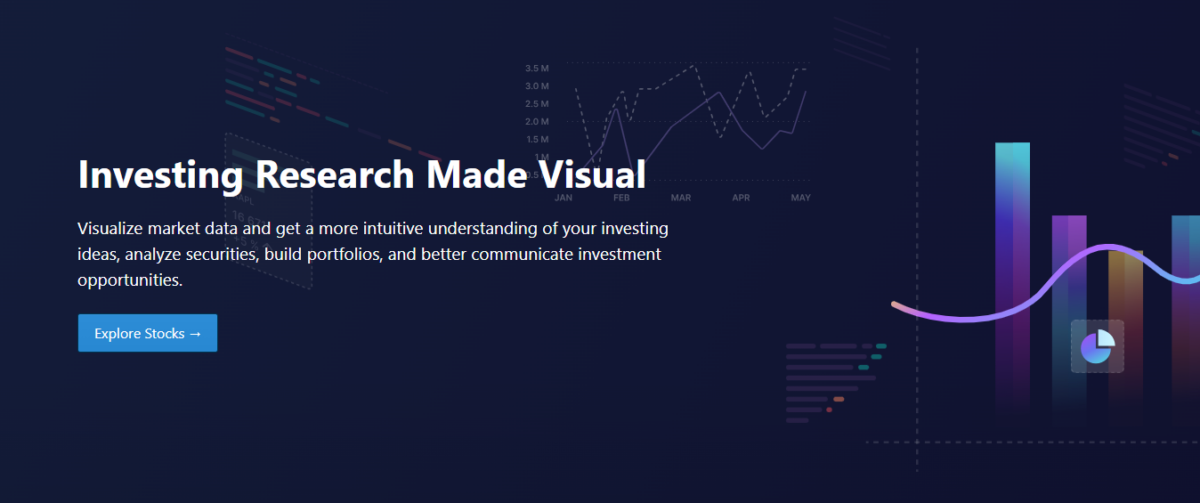
FullRatio covers some powerful customizable tools that increase your research efficiency. You can start by going to particular stock industry sectors and clicking on individual stocks.
For example, clicking on AAPL stock opens up detailed information about stocks fundamental and technical aspects. Fundamentals covered are price, market cap, P/E ratio, dividend yield, EPS, and quick single sentence highlights on the past performance.
TipRanks
TipRanks helps traders and investors make data-driven decisions with the help of research tools and the latest stock market news. It covers news from financial experts, corporations, finance bloggers, and hedge funds for retail investors.
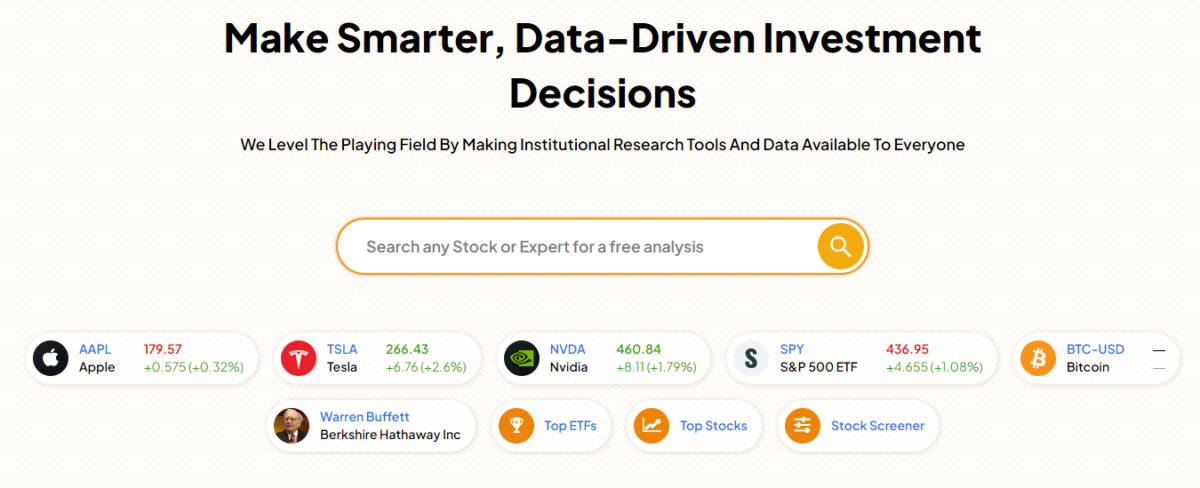
From the TipRanks stock search bar, you can type the stock name and get quick updates on price movements. Besides, the platform covers four aspects for every stock – analysis, forecast, chart, and news. You can see the trade calls based on analysts’ ratings and forecasts for stock prices.
For technical analysis, click on the chart button and you can view the stock chart in different chart-type formats like line chart, area, candlestick patterns, histogram, and more. You can add indicators like volume and track the performance on daily, weekly, and monthly timeframes.
Some other prominent TipRanks research tools include earnings calendar, dividend calendar, IPO calendar, daily analysts ratings, ETF screener, and more.
Stock Analysis
Stock Analysis is a popular platform that provides a range of charting tools and technical chart indicators. The platform contains information on 6000+ stocks and provides financial information like prices, trending news, events, and technical charts.
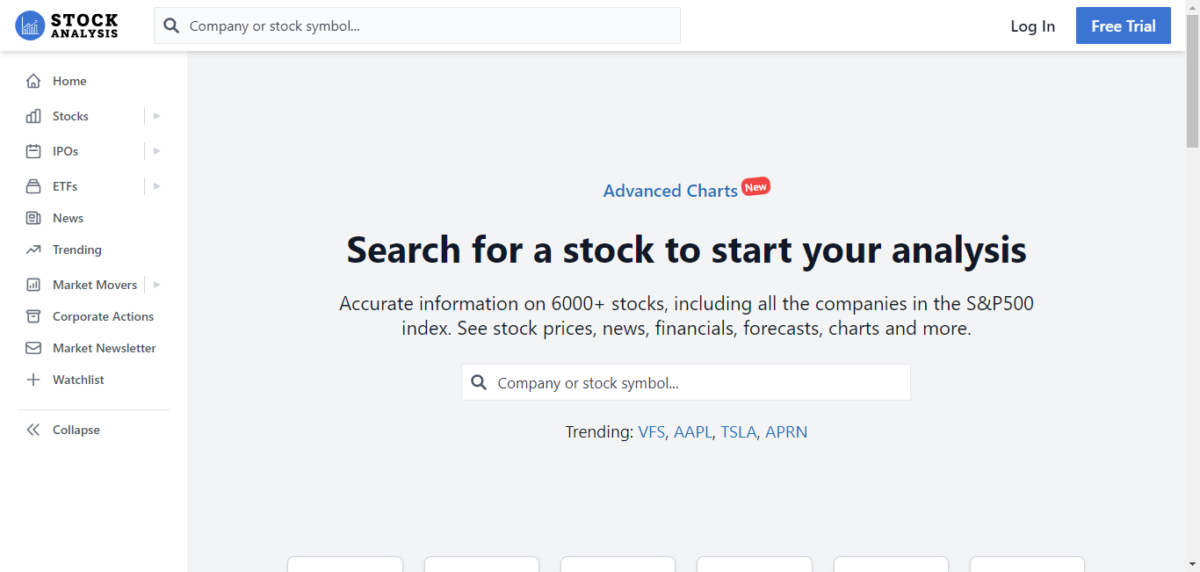
It is a free website, and you can find the daily top losers and gainers on the homepage. Besides, the platform has a stock screener that filters out the stocks based on your criteria. You can also find the most active stocks in the premarket and after-market hours.
Stock Analysis website keeps you updated about ongoing events in the S&P500 index. The market news section curates all the trending and recent news about companies in a single place. There’s an IPO calendar available that lists all the recently listed IPOs with all the essential details. You can keep track of upcoming IPOs within the same calendar.
WallStreetZen
WallStreetZen is a stock research platform that helps you interpret data for better investment decisions. You get historical data and stock fundamentals in an intuitive visual format that’s easy to understand even for non-finance background people.
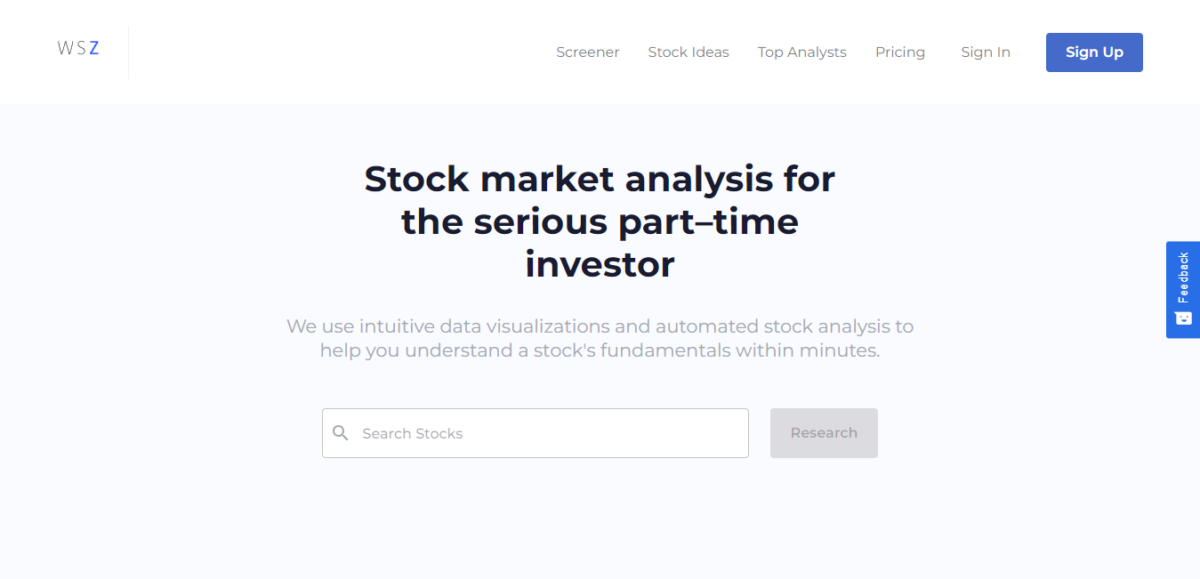
The platform offers useful financial tools like stock screeners to help you identify trading opportunities that match your filters and criteria. The screener is impressive as it provides readymade filters based on price, valuation, dividends, earnings, revenue forecast, and technical indicators.
We quickly ran the price screener and got deep insights into the returns in the last three, five, and ten years.
WallStreetZen also has a unique indicator called as Zen Score that checks stock fundamentals across five dimensions. These dimensions are Valuation, Forecast, Performance, Financials, and Dividends. This score is calculated by running 38 automated due diligence checks, and you get the summary in a single line.
Summary
Whether it’s short-term trading or long-term investing, better returns are possible when backed by accurate data. By using the above-mentioned financial research platforms, you’re backing the results with well-researched data.
If you’re interested in learning more about stock market trading and investments, make sure to check out our comprehensive guide on financial markets news portals to stay up-to-date as an investor.
Si quiere puede hacernos una donación por el trabajo que hacemos, lo apreciaremos mucho.
Direcciones de Billetera:
- BTC: 14xsuQRtT3Abek4zgDWZxJXs9VRdwxyPUS
- USDT: TQmV9FyrcpeaZMro3M1yeEHnNjv7xKZDNe
- BNB: 0x2fdb9034507b6d505d351a6f59d877040d0edb0f
- DOGE: D5SZesmFQGYVkE5trYYLF8hNPBgXgYcmrx
También puede seguirnos en nuestras Redes sociales para mantenerse al tanto de los últimos post de la web:
- Telegram
Disclaimer: En Cryptoshitcompra.com no nos hacemos responsables de ninguna inversión de ningún visitante, nosotros simplemente damos información sobre Tokens, juegos NFT y criptomonedas, no recomendamos inversiones