


Are you interested in analyzing your data using natural language? Learn how to do so using the Python library PandasAI.

In a world where data is crucial, understanding and analyzing it is essential. However, traditional data analysis can be complex. That’s where PandasAI comes in. It simplifies data analysis by letting you talk to your data using natural language.
Pandas AI works by turning your questions into code for data analysis. It’s based on the popular Python library pandas. PandasAI is a Python library that extends pandas, the well-known data analysis and manipulation tool, with Generative AI features. It’s intended to complement pandas rather than replace them.
PandasAI introduces a conversational aspect to pandas (as well as other widely-used data analysis libraries), enabling you to interact with your data using natural language queries.
 cryptoshitcompra.com/wp-content/uploads/2023/10/1697811987_601_Analyze-Your-Data-Using-Natural-Language.jpg»/>
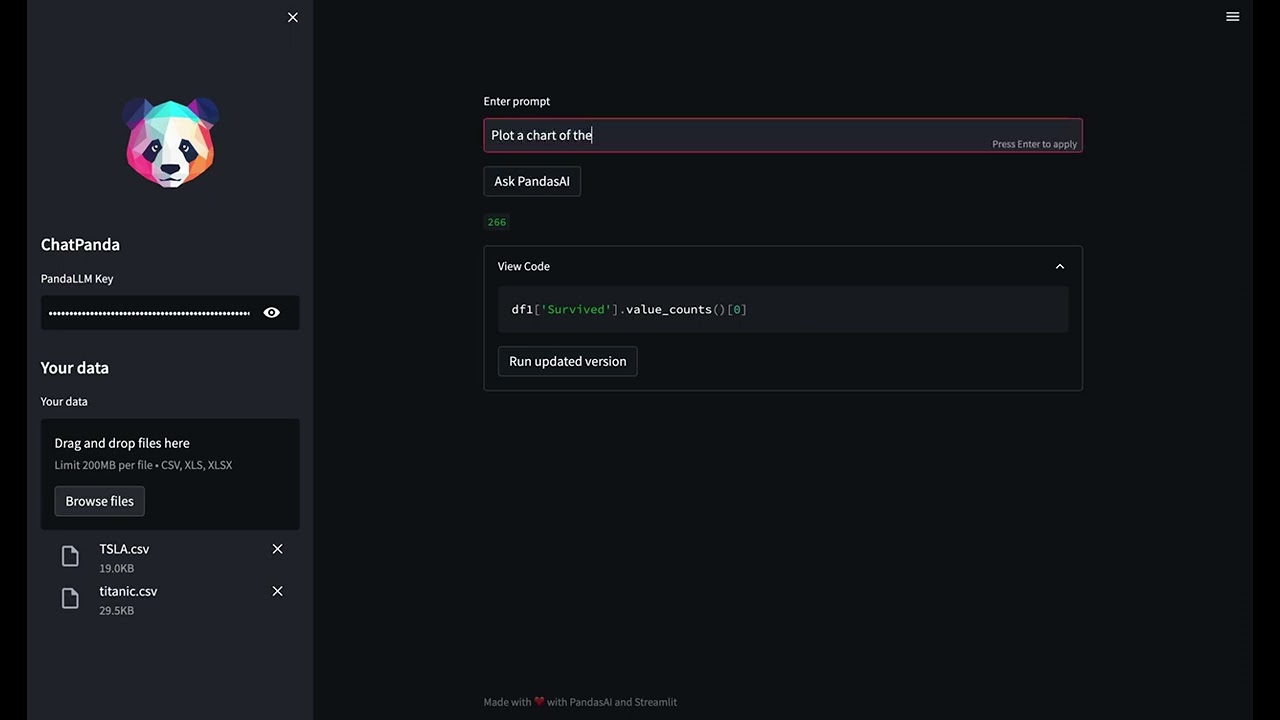
This tutorial will walk you through the steps of setting up Pandas AI, using it with a real-world dataset, creating plots, exploring shortcuts, and exploring the strengths and limitations of this potent tool.
After completing it, you’ll be able to perform data analysis more easily and intuitively using natural language.
So, let’s explore the fascinating world of natural language data analysis with Pandas AI!
Setting Up Your Environment
To get started with PandasAI, you should begin by installing the PandasAI library.
I’m using a Jupyter Notebook for this project. But you can use Google Collab or VS Code as per your requirements.
If you plan to use Open AI Large Language Models (LLMs), it’s also important to install the Open AI Python SDK for a smooth experience.
# Installing Pandas AI
!pip install pandas-ai
# Pandas AI uses OpenAI's language models, so you need to install the OpenAI Python SDK
!pip install openai
Now, Let’s import all necessary libraries:
# Importing necessary libraries
import pandas as pd
import numpy as np

# Importing PandasAI and its components
from pandasai import PandasAI, SmartDataframe
from pandasai.llm.openai import OpenAI
A key aspect of data analysis using PandasAI is the API key. This tool supports several Large Language Models (LLMs) and LangChains models, which are used to generate code from natural language queries. This makes data analysis more accessible and user-friendly.
PandasAI is versatile and can work with various types of models. These include Hugging Face models, Azure OpenAI, Google PALM, and Google VertexAI. Each of these models brings its own strengths to the table, enhancing the capabilities of PandasAI.
Remember, to use these models, you’ll need the appropriate API keys. These keys authenticate your requests and allow you to leverage the power of these advanced language models in your data analysis tasks. So, make sure to have your API keys handy when setting up PandasAI for your projects.
You can fetch the API Key, and export it as an environment variable.
In the next step, you’ll learn how to use PandasAI with different types of large language models (LLMs) from OpenAI and Hugging Face Hub.
Using Large Language Models
You can either choose an LLM by instantiating one and passing it to the SmartDataFrame or SmartDatalake constructor, or you can specify one in the pandasai.json file.
If the model expects one or more parameters, you can pass them to the constructor or specify them in the pandasai.json file in the llm_options param, as follows:
{
  "llm": "OpenAI",
  "llm_options": {
    "api_token": "API_TOKEN_GOES_HERE"
  }
}
How to use OpenAI models?
In order to use OpenAI models, you need to have an OpenAI API key. You can get one here.
Once you have an API key, you can use it to instantiate an OpenAI object:
#We have imported all necessary libraries in privious step

llm = OpenAI(api_token="my-api-key")
pandas_ai = SmartDataframe("data.csv", config={"llm": llm})
Don’t forget to replace “my-api-key” with your original API key
As an alternative, you can set the OPENAI_API_KEY environment variable and instantiate the OpenAI object without passing the API key:
# Set the OPENAI_API_KEY environment variable
llm = OpenAI() # no need to pass the API key, it will be read from the environment variable
pandas_ai = SmartDataframe("data.csv", config={"llm": llm})
If you are behind an explicit proxy, you can specify openai_proxy when instantiating the OpenAI object or set the OPENAI_PROXY environment variable to pass through.
Important Note: When using the PandasAI library for data analysis with your API key, it’s important to keep track of your token usage to manage costs.
Wondering how to do this? Simply run the following token counter code to get a clear picture of your token usage and the corresponding charges. This way, you can effectively manage your resources and avoid any surprises in your billing.
You can count the number of tokens used by a prompt as follows:
"""Example of using PandasAI with a pandas dataframe"""

from pandasai import SmartDataframe
from pandasai.llm import OpenAI
from pandasai.helpers.openai_info import get_openai_callback
import pandas as pd
llm = OpenAI()
# conversational=False is supposed to display lower usage and cost
df = SmartDataframe("data.csv", {"llm": llm, "conversational": False})

with get_openai_callback() as cb:
    response = df.chat("Calculate the sum of the gdp of north american countries")
    print(response)
    print(cb)
You will get results like this:
#  The sum of the GDP of North American countries is 19,294,482,071,552.

#  Tokens Used: 375
#   Prompt Tokens: 210
#   Completion Tokens: 165
# Total Cost (USD): $ 0.000750
Don’t forget to keep a record of your total cost if you have limited credit!
How to use Hugging Face Models?
In order to use HuggingFace models, you need to have a HuggingFace API key. You can create a HuggingFace account here and get an API key here.
Once you have an API key, you can use it to instantiate one of the HuggingFace models.
At the moment, PandasAI supports the following HuggingFace models:
- Starcoder: bigcode/starcoder
- Falcon: tiiuae/falcon-7b-instruct
from pandasai.llm import Starcoder, Falcon
llm = Starcoder(api_token="my-huggingface-api-key")
                    # or
llm = Falcon(api_token="my-huggingface-api-key")
df = SmartDataframe("data.csv", config={"llm": llm})
As an alternative, you can set the HUGGINGFACE_API_KEY environment variable and instantiate the HuggingFace object without passing the API key:
from pandasai.llm import Starcoder, Falcon
llm = Starcoder() # no need to pass the API key, it will be read from the environment variable
                                       # or
llm = Falcon() # no need to pass the API key, it will be read from the environment variable
df = SmartDataframe("data.csv", config={"llm": llm})
Starcoder and Falcon are both LLM models available on Hugging Face.
We’ve successfully set up our environment and explored how to use both OpenAI and Hugging Face LLMs models. Now, let’s move forward with our data analysis journey.
We are going to use the dataset Big Mart Sales data, which contains information about the sales of various products in different outlets of Big Mart. The dataset has 12 columns and 8524 rows. You’ll get the link at the end of the article.
Data Analysis with PandasAI
Now that we’ve successfully installed and imported all the necessary libraries, let’s proceed to load our dataset.
Load the Dataset
You can either choose a LLM by instantiating one and passing it to the SmartDataFrame. You’ll get the link to the dataset at the end of the article.
#Load the dataset from device
path = r"D:\Pandas AI\Train.csv"
df = SmartDataframe(path)
Use OpenAI’s LLM model
After loading our data. I’m going to use OpenAI’s LLM model to use PandasAI
llm = OpenAI(api_token="API_Key")
pandas_ai = PandasAI(llm, conversational=False)
All Good! Now, Let’s try to use prompts.
Print the first 6 rows of our dataset
Let’s try to load the first 6 rows, by providing instructions:
Result = pandas_ai(df, "Show the first 6 rows of data in tabular form")
Result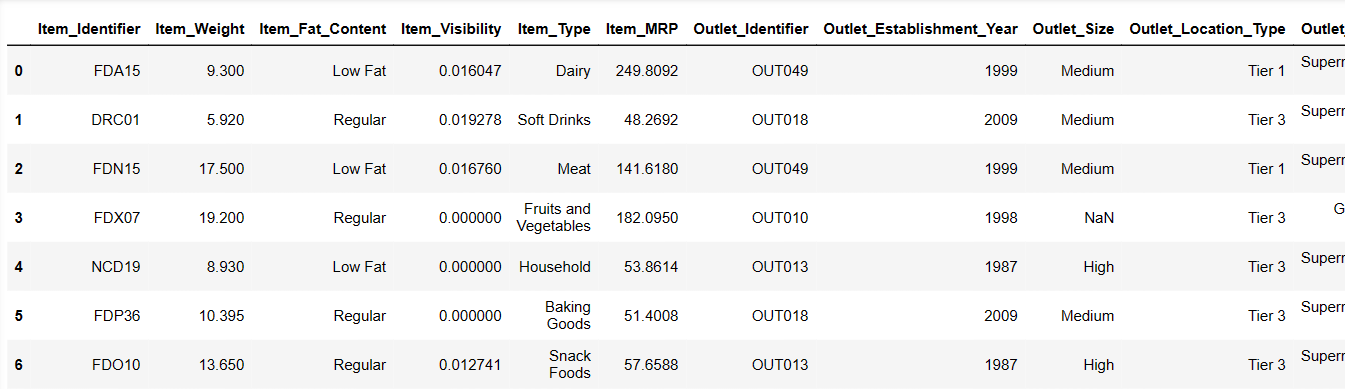
That was really quick! Let’s understand our dataset.
Generating Descriptive Statistics of DataFrame
# To get descriptive statistics
Result = pandas_ai(df, "Show the description of data in tabular form")
Result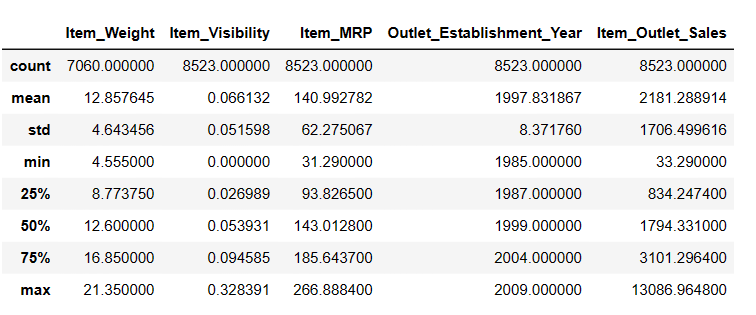
There are 7060 values in Item_Weigth; maybe there are some missing values.
Find Missing Values
There are two ways to find missing values using pandas ai.
#Find missing values
Result = pandas_ai(df, "Show the missing values of data in tabular form")
Result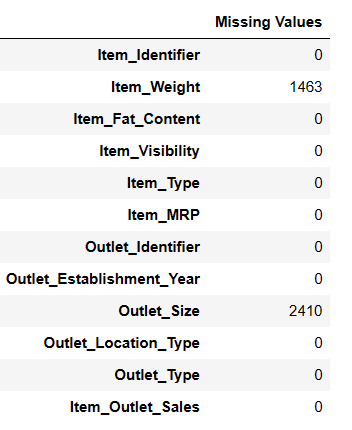
# Shortcut for Data Cleaning
df = SmartDataframe('data.csv')
df.clean_data()
This shortcut will do data cleaning on the data frame.
Now, Let’s fill in the missing null values.
Fill Missing Values
#Fill Missing values
result = pandas_ai(df, "Fill Item Weight with median and Item outlet size null values with mode and Show the missing values of data in tabular form")
result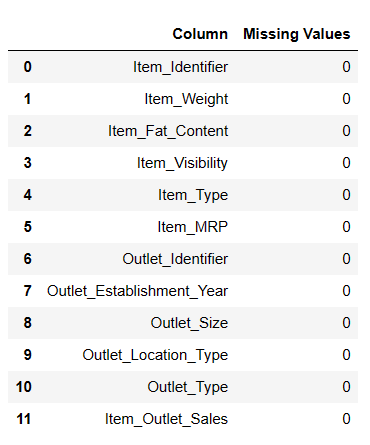
It is a useful method to fill null values, but I faced some problems while filling null values.
# Shortcut for Fill Null Values
df = SmartDataframe('data.csv')
df.impute_missing_values()
This shortcut will impute missing values in the data frame.
Drop Null Values
If you want to drop all null values from your df then you can try this method.
result = pandas_ai(df, "Drop the row with missing values with inplace=True")
result
Data analysis is essential for identifying trends, both short-term and long-term, which can be invaluable for businesses, governments, researchers, and individuals.
Let’s try to find an overall sales trend over the years since its establishment.
Finding Sales Trend
# finding trend in sales
result = pandas_ai(df, "What is the overall trend in sales over the years since outlet establishment?")
result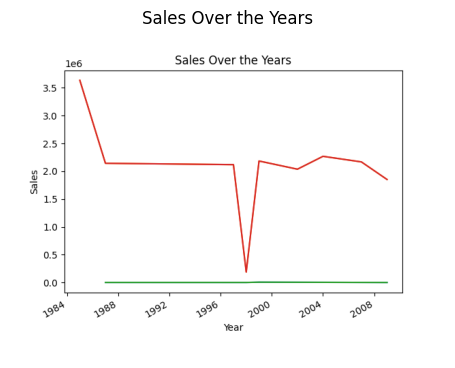
The initial plot creation process was a bit slow, but after restarting the kernel and running it all, it ran faster.
# Shortcut to plot line plots
df.plot_line_chart(x = ['a', 'b', 'c'], y = [1, 2, 3])This shortcut will plot a line chart of the data frame.
You might be wondering why there is a decline in the trend. It’s due to we don’t have data from 1989 to 1994.
Finding Year of Highest Sales
Now, Let’s find out which year has the highest sales.
# finding year of highest sales
result = pandas_ai(df, "Explain which years have highest sales")
result
So, the year with the highest sales is 1985.
But, I want to find out which Item type generates the highest average sales and which type generates the lowest average sales.
Highest and Lowest Average Sales
# finding highest and lowest average sale
result = pandas_ai(df, "Which item type generates the highest average sales, and which one generates the lowest?")
result
Starchy Foods have the highest average sales and Others have the lowest average sales. If you don’t want others as the lowest sales, you can improve prompt as per your need.
Superb! Now, I want to find out the distribution of sales across different outlets.
Distribution of Sales Across Different Outlets
There are four types of outlets: Supermarket Type 1/2/3 and Grocery stores.
# distribution of sales across different outlet types since establishment
response = pandas_ai(df, "Visualize the distribution of sales across different outlet types since establishment using bar plot, plot size=(13,10)")
response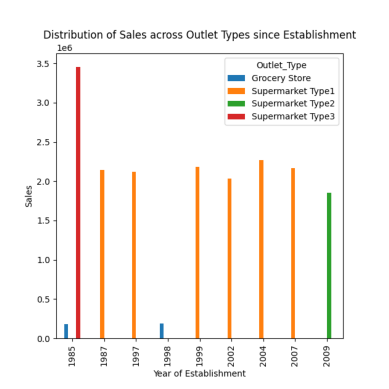
As observed in previous prompts, the peak sales occurred in 1985, and this plot highlights the highest sales in 1985 from supermarket type 3 outlets.
# Shortcut to Plot Bar Chart
df = SmartDataframe('data.csv')
df.plot_bar_chart(x = ['a', 'b', 'c'], y = [1, 2, 3])
This shortcut will plot a bar chart of the data frame.
# Shortcut to Plot Histogram
df = SmartDataframe('data.csv')
df.plot_histogram(column = 'a')
This shortcut will plot a histogram of the data frame.
Now, Let’s find out What are the average sales for the items with ‘Low Fat’ and ‘Regular’ item fat content.
Find Averages Sales for Items with fat Contents
# finding index of a row using value of a column
result = pandas_ai(df, "What is the average sales for the items with 'Low Fat' and 'Regular' item fat content?")
result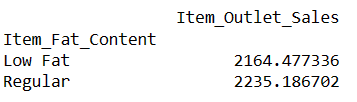
Writing prompts like this allows you to compare two or more products.
Average Sales for Each Item Type
I want to compare all products with their average sales.
#Average Sales for Each Item Type
result = pandas_ai(df, "What are the average sales for each item type over the past 5 years?, use pie plot, size=(6,6)")
result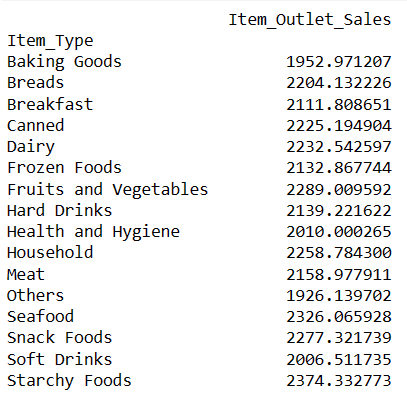
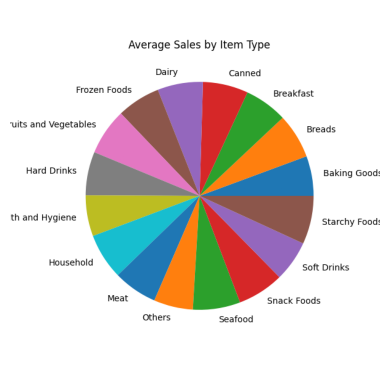
All sections of the pie chart appear similar because they have nearly the same sales figures.
# Shortcut to Plot Pie Chart
df.plot_pie_chart(labels = ['a', 'b', 'c'], values = [1, 2, 3])This shortcut will plot a pie chart of the data frame.
Top 5 Highest Selling Item Types
While we’ve already compared all products based on average sales, now I’d like to identify the top 5 items with the highest sales.
#Finding top 5 highest selling items
result = pandas_ai(df, "What are the top 5 highest selling item type based on average sells? Write in tablular form")
result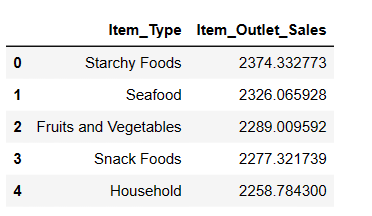
As expected, Starchy Foods is the highest-selling item based on average sales.
Top 5 Lowest Selling Item Types
result = pandas_ai(df, "What are the top 5 lowest selling item type based on average sells?")
result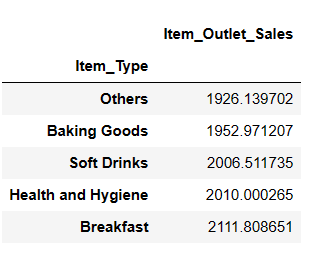
You might be surprised to see soft drinks in the lowest-selling category. However, it’s essential to note that this data only goes up to 2008, and the trend for soft drinks took off a few years later.
Sales of Product Categories
Here, I used the word “product category” instead of “item type,” and PandasAI still created the plots, showing its understanding of similar words.
result = pandas_ai(df, "Give a stacked large size bar chart of the sales of the various product categories for the last FY")
result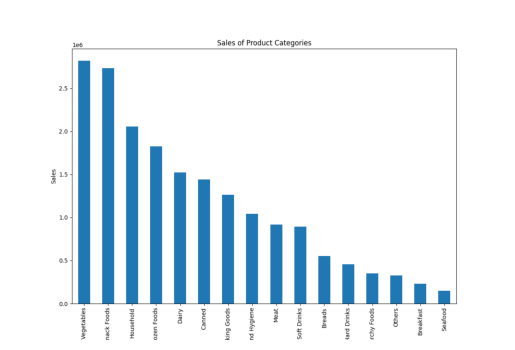
You can find our remaining shortcuts Here.
You may notice that when we write a prompt and provide instructions to a PandasAI, it provides results based solely on that specific prompt. It does not analyze your previous prompts to offer more accurate answers.
However, with the assistance of a chat agent, you can achieve this functionality as well.
Chat Agent
With the chat agent, you can engage in dynamic conversations where the agent retains context throughout the discussion. This enables you to have more interactive and meaningful exchanges.
The key features that empower this interaction include Context Retention, where the agent remembers the conversation history, allowing for seamless, context-aware interactions. You can use the Clarification Questions method to request clarification on any aspect of the conversation, ensuring you fully understand the information provided.
Moreover, the Explain method is available to obtain detailed explanations of how the agent arrived at a particular solution or response, offering transparency and insights into the agent’s decision-making process.
Feel free to initiate conversations, seek clarifications, and explore explanations to enhance your interactions with the chat agent!
from pandasai import Agent
agent = Agent(df, config={"llm": llm}, memory_size=10)
result = agent.chat("Which are top 5 items with highest MRP")
result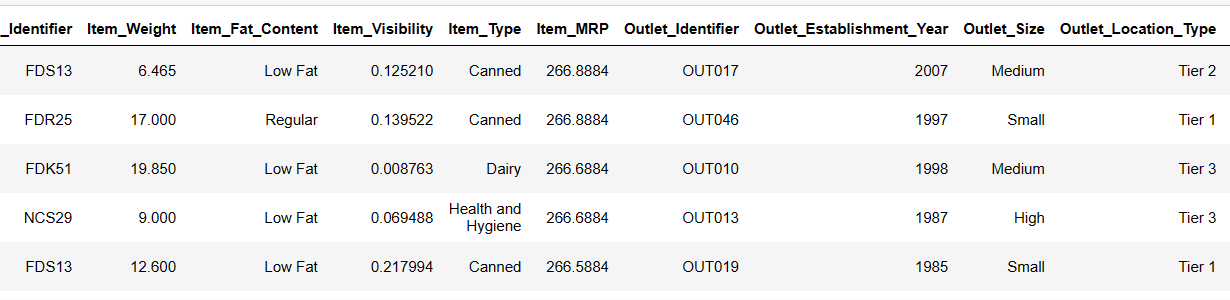
Contrary to a SmartDataframe or a SmartDatalake, an agent will keep track of the state of the conversation and will be able to answer multi-turn conversations.
Let’s move toward the Advantages and Limitations of PandasAI
Advantages of PandasAI
Using Pandas AI offers several advantages that make it a valuable tool for data analysis, such as:
- Accessibility: PandasAI simplifies data analysis, making it accessible to a wide range of users. Anyone, regardless of their technical background, can use it to extract insights from data and answer business questions.
- Natural Language Queries: The ability to ask questions directly and receive answers from data using natural language queries makes data exploration and analysis more user-friendly. This feature enables even non-technical users to interact with data effectively.
- Agent Chat Functionality: The chat function allows users to engage with data interactively, while the agent chat feature leverages previous chat history to provide context-aware answers. This promotes a dynamic and conversational approach to data analysis.
- Data Visualization: PandasAI provides a range of data visualization options, including heatmap, scatter plots, bar plots, pie charts, line plots, and more. These visualizations aid in understanding and presenting data patterns and trends.
- Time-Saving Shortcuts: The availability of shortcuts and time-saving features streamlines the data analysis process, helping users work more efficiently and effectively.
- File Compatibility: PandasAI supports various file formats, including CSV, Excel, Google Sheets, and more. This flexibility allows users to work with data from a variety of sources and formats.
- Custom Prompts: Users can create custom prompts using simple instructions and Python code. This feature empowers users to tailor their interactions with data to suit specific needs and queries.
- Save Changes: The ability to save changes made to dataframes ensures that your work is preserved, and you can revisit and share your analysis at any time.
- Custom Responses: The option to create custom responses enables users to define specific behaviors or interactions, making the tool even more versatile.
- Model Integration: PandasAI supports various language models, including those from Hugging Face, Azure, Google Palm, Google VertexAI, and LangChain models. This integration enhances the tool’s capabilities and enables advanced natural language processing and understanding.
- Built-in LangChain Support: The built-in support for LangChain models further expands the range of models and functionalities available, enhancing the depth of analysis and insights that can be derived from the data.
- Understand Names: PandasAI demonstrates the capability to understand the correlation between column names and real-life terminology. For instance, even if you use terms like “product category” instead of “item type” in your prompts, the tool can still provide relevant and accurate results. This flexibility in recognizing synonyms and mapping them to the appropriate data columns enhances user convenience and the tool’s adaptability to natural language queries.
While PandasAI offers several advantages, it also comes with some limitations and challenges that users should be aware of:
Limitations of PandasAI
Here are some limitations that I observed:
- API Key Requirement: To use PandasAI, having an API key is essential. If you don’t have sufficient credits in your OpenAI account, you may not be able to use the service. However, it’s worth noting that OpenAI provides a $5 credit for new users, making it accessible for those new to the platform.
- Processing Time: Sometimes, the service may experience delays in providing results, which can be attributed to high usage or server load. Users should be prepared for potential wait times when querying the service.
- Interpretation of Prompts: While you can ask questions via prompts, the system’s ability to explain answers may not be fully developed, and the quality of explanations may vary. This aspect of PandasAI may improve in the future with further development.
- Prompt Sensitivity: Users need to be careful when crafting prompts, as even slight changes can lead to different results. This sensitivity to phrasing and prompt structure can impact the consistency of results, especially when working with data plots or more complex queries.
- Limitations on Complex Prompts: PandasAI may not handle highly complex prompts or queries as effectively as simpler ones. Users should be mindful of the complexity of their questions and ensure that the tool is suitable for their specific needs.
- Inconsistent DataFrame Changes: Users have reported issues with making changes to DataFrames, such as filling null values or dropping null value rows, even when specifying ‘Inplace=True.’ This inconsistency can be frustrating for users trying to modify their data.
- Variable Results: When restarting a kernel or re-running prompts, it’s possible to receive different results or interpretations of data from previous runs. This variability can be challenging for users who require consistent and reproducible results. Not applicable to all prompts.
You can download the dataset here.
The code is available on GitHub.
Conclusion
PandasAI offers a user-friendly approach to data analysis, accessible even to those without extensive coding skills.
In this article, I’ve covered how to set up and utilize PandasAI for data analysis, including creating plots, handling null values, and taking advantage of agent chat functionality.
Subscribe to our newsletter for more informative articles. You may be interested in learning about AI models for creating generative AI.
Was this article helpful?
Thank you for your feedback!
Si quiere puede hacernos una donación por el trabajo que hacemos, lo apreciaremos mucho.
Direcciones de Billetera:
- BTC: 14xsuQRtT3Abek4zgDWZxJXs9VRdwxyPUS
- USDT: TQmV9FyrcpeaZMro3M1yeEHnNjv7xKZDNe
- BNB: 0x2fdb9034507b6d505d351a6f59d877040d0edb0f
- DOGE: D5SZesmFQGYVkE5trYYLF8hNPBgXgYcmrx
También puede seguirnos en nuestras Redes sociales para mantenerse al tanto de los últimos post de la web:
- Telegram
Disclaimer: En Cryptoshitcompra.com no nos hacemos responsables de ninguna inversión de ningún visitante, nosotros simplemente damos información sobre Tokens, juegos NFT y criptomonedas, no recomendamos inversiones